Wuhan Waves vs Spanish Flu
Can the Spanish Flu offer insights into current unseasonal deaths?
“Epidemic waves serve not just to predict but also to persuade. Their special blend of mathematical and moral messaging will shape the future of the pandemic.”
- The Shape of Epidemics, Boston Review , June 2020.
Recap: The MSM and Public Health continue to ignore or underplay the ongoing increased excess mortality seen in Germany and in many other countries around the world from 2022 (see my previous posts: Record-High German Deaths and Seasonal Shifts?). The primary reason these increases should be so concerning is that these excess deaths are reportedly not from Covid-19 and the so-called pandemic is reputedly over. In which case, we should expect a post-pandemic decline in excess mortality for 2022 or at the very least a plateauing.

Having long accepted this premise that the aftermath of the pandemic should feature deficit deaths (mortality displacement1) I was very surprised to recently have a video recommended to me purporting to debunk a popular medical vlogger who is also very concerned about recent excess deaths currently observed in data from around the world. Any truth seeker worth their salt remains alert to counter arguments and especially those which challenge our prevailing biases, so, ready to test my pet theories against competing theories, I decided to give the video a watch.
And I am very glad I did watch because it led me to the following journal article from 1932 by Selwyn D. Collins, senior statistician of the United States Public Health Service, entitled “Excess Mortality from Causes other than Influenza and Pneumonia during Influenza Epidemics2”
The debunking science-educator on YouToob cited the following excerpt as “proof” that excess deaths after a pandemic are expected and excess deaths greater than Covid deaths was not a cause for alarm, and therefore we were all being duped by claims to the contrary (bold emphasis, mine):
A study of excess mortality from all causes during the various respiratory epidemics that have occured during the past 15 years indicates that in every one the excess mortality from all causes was appreciably higher than the excess mortality credited to influenza and pneumonia. If this situation were true of only one or two of the epidemics, it might be assumed that an unrelated epidemic of some other disease occured simultaneuously with the influenzy epidemic; but when every outbreak repeats the phenomenon, it can hardly be concluded that the excess deaths from causes other than influenza and pneumonia are unrelated to the excess deaths from influenza and pneumonia.
Hmm, very interesting, this echoes some of what we have observed in excess deaths data during the Covid-19 pandemic. So I sought out the paper for myself to see what could be gleaned from the excess deaths data of the Spanish flu with regards to our current situation. The article is based on official weekly deaths data from public health authorities for 35 large US cities with an aggregate of nearly 25 million inhabitants between 1917-1929. Disclaimer: obviously all comparisons between a pandemic of a hundred years ago and our current situation are to be taken with caution although comparisons with the 1918- 19 pandemic have becom common in the study of the COVID-19.
Let’s dive into some epidemic waves…
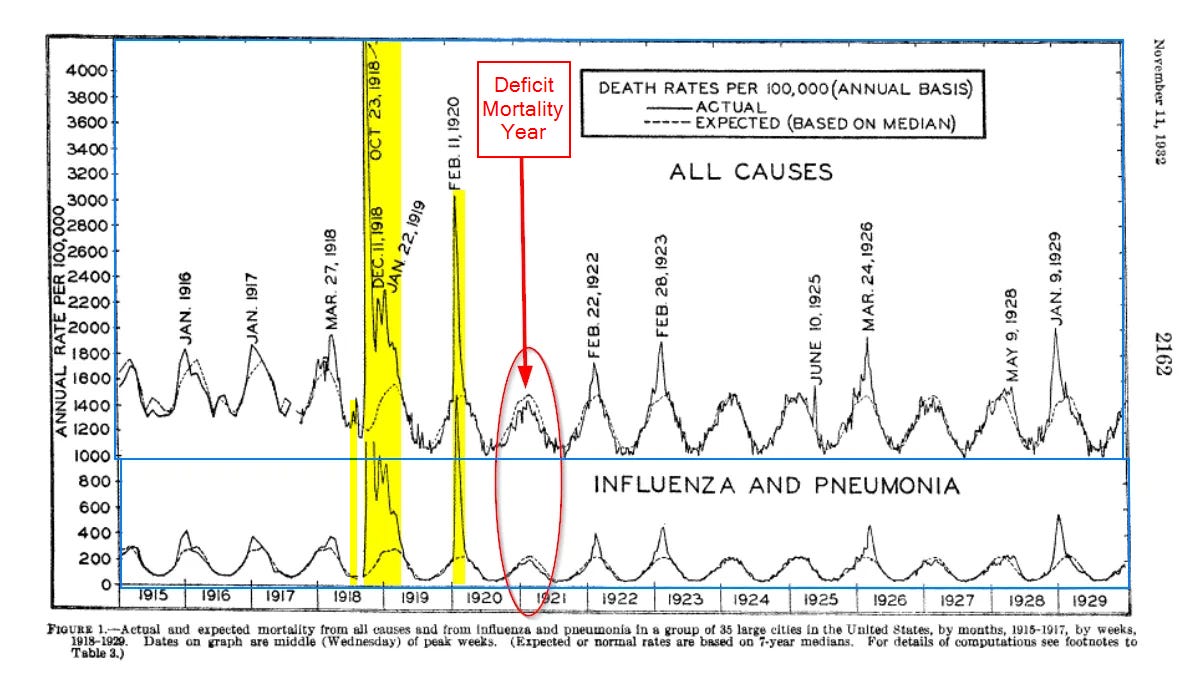
This first chart is divided into two with the upper section showing all-cause death rates per 100,000 while the lower breaks out the (EDIT: excess) deaths attributable to influenza and pneumonia. Solid lines indicate actual deaths, broken lines represent expected, which are based on 7-year medians: 1921-27 for period after July 2019; 1910-16 for period prior. Whereby these 7-year medians reveal a notable discrepancy between pre- and post-1919 death rates and, because of this, the elevated death rates depicted for 1915 to early 1918 in the chart do not result in high excess deaths in the lower section, although actual death rates were higher in the pre-1919 period (see footnotes of the original article for further explanatory notes):
Wow! The immediate thing that jumps out is deaths were literally off the charts in October 1918. That is scary levels of mortality which certainly puts the hysteria of the coddled Covid pandemic into perspective. For example, October 1918 saw approximately 1 in 200 people die in a single month averaged across those 35 American cities, which was ~4x the normal death rate at the time. Also very notable is how influenza became endemic, sticking around and causing multiple mini epidemics through the following decade (with associated deficit periods in between!).
Similarities and Differences
The spring pandemic wave of 1918 followed by autumn/winter waves 1918/19, and then winter 1919/20 is very reminscent of the start of the Covid pandemic. Like the initial Covid-19 waves, where deaths fell to normal pre-pandemic levels, after the influenza waves of winter 1918/19 and 1919/20 deaths similarly decreased although more significantly to a new base level! In stark contrast to Covid-19, the Spanish Flu then skipped a winter in 1920/21 which resulted in a year of deficit mortality whereas the UK and Germany have still seen only modest decreases in mortality rates. At this point I was left wondering if the YouToob science-educator even bothered to read this paper through before presenting it as evidence for their claim “Excess deaths after a pandemic are absolutely 100% to be expected”. This study shows the contrary -deficit deaths invariably follow epidemics!
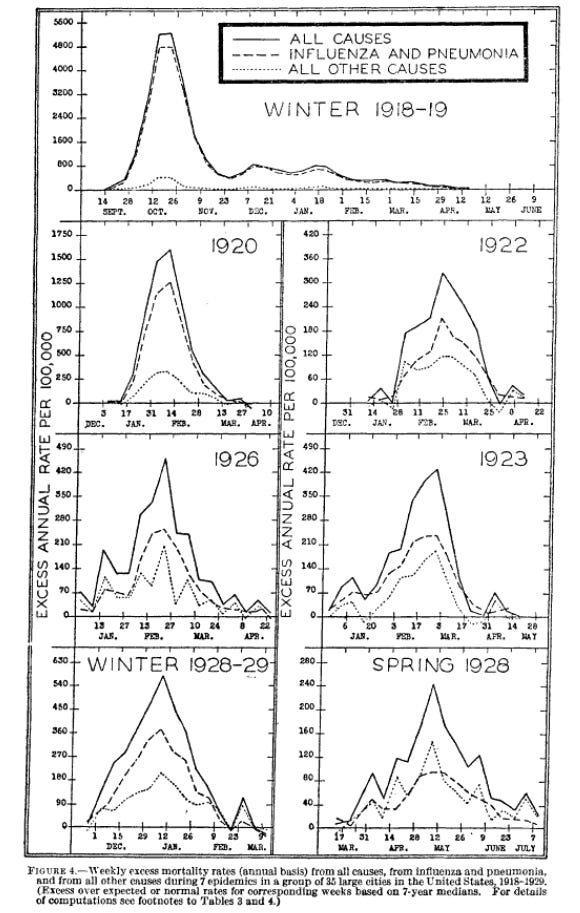
Perhaps the following chart is what they found compelling? It shows both the initial drastic fall of excess deaths after 1918-20 but also the breakdown of the excess deaths during eleven epidemics 1915-1929. However, unlike the deaths totals for Covid-related excess deaths in Germany and UK (and other countries) from last year, influenza (& pneumonia) remained the predominant cause of excess death for the remaining decade only falling below 50% first in 1928.
Granted, the concommitance of peaks in excess deaths due to causes other than influenza & pneumonia during epidemic waves of the Spanish Flu is certainly interesting although perhaps not so surprising:
For example, the author in 1932 makes arguments very familiar to skeptics of official Covid deaths data 90 years later:
One possible explanation would be that persons with chronic diseases are easy victims of influenza and pneumonia and many die during the epidemics. In such cases some doctors might record the death as due to the condition that had existed longer and was primary in point of time while others might record it as due to the acute condition which was the reason for the death occurring at the particular time. Such deaths are obviously the joint result of both conditions and the necessity of choosing one cause as primary leads to difficulties that are not easily disposed of.
While I suspect we cannot rule out the undercounting of Covid-associated deaths in 2022, (especially if we regard the undulating waves of PCR test positivity curves that are hidden behind weak case numbers due to drastically reduced testing regimes - see previous post), excess deaths as currently reported are disproportionately from causes other than Covid-19.
Perhaps the self-proclaimed debunker wanted to highlight the increased percentage of heart disease-related deaths in the non-influenza/pneumonia excess deaths during the successive epidemic waves? I agree this is very interesting and one to keep an eye on but, I repeat, influenza and pneumonia remained the predominant cause whereas the currently reported figures report Covid for considerably less than half.
In the case of organic heart diseases there was a peak, corresponding in time with the influenza peak, for practically every epidemic. The heights of the peaks were relatively small, but they were sufficiently above other rates to be definitely more than would be expected at that season of the year. Nephritis and diabetes both had some peaks corresponding in time to the influenza peaks, but they were smaller and less definite than in the case of organic heart diseases.
Original Author’s Summary
There is lots of granular detail available in the original report and it is interesting to read through if you care to do so. Here is the original summary with some observations highlighted by me:
My Summary and Takeaways
What this journal article from 1932 most definitely does NOT show is sustained excess mortality predominantly attributable to causes other than the pandemic virus of the day (1920’s: influenza & pneumonia) such as we are currently seeing. What it does point to is concomittant excess death from other causes during epidemic waves BUT influenza & pneumonia definitively remained the majority cause of excess deaths. It also points to the developing endemicity of influenza with the progress of time, the recurrence of minor epidemics, and a decreasing proportion of excess deaths directly attributable to influenza during succesive outbreaks.
My biggest takeaway: (isolated?)recurring outbreaks of Covid in the coming years ought to be expected BUT it affirms we SHOULD experience periods of deficit deaths in-between.
Recall this graphic from my previous post. It shows almost the complete opposite of the data from the journal article on from 1932: an apparently increased baseline of deaths post initial pandemic spikes; and an inverted proportion of all-cause excess deaths attributable to the pandemic virus. Just what was that debunker thinking? ;)
Bonus Thoughts and Graphs
While reading Igor Chudov‘s recent post “Is Geert's Prediction of a Deadlier Covid Variant Coming True?” I was struck by a strong periodicity visible in the most recent Covid waves. For example, German, UK, and Danish data all seem to indicate an approximately 3-month periodicity between recent Covid peaks3456
Is there also a similar pattern visible in recent deaths data from Euromo7?
In a weird way, public health in many nations did manage to “flatten the curve”. No, I don’t mean they dampened the initial waves of infection, hospitalisations, and death. As mentioned in my previous post, I consider those waves to have been self-limiting or seasonally limited. Rather, in the reputed aftermath of the pandemic and especially since the booster vaccination campaigns, we have witnessed a “flattened” BUT near-continuous low-level rolling wave of excess death instead.
Was anyone predicting8 such frequent epidemic waves of COVID-19 when this all started?? As Geert Vanden Bossche, Rintrah Radagast, Igor Chudov and others have warned, just what are the long-term consequences for individual immune systems and society if you can potentially get infected by Covid-19 multiple times a year?
History of Pandemic Waves
If you would like to dive further into the history of WAVES in epidemiology I can recommend this richly referenced article The Shape of Epidemics9 in the Boston Review from June 2020:
“Epidemic waves serve not just to predict but also to persuade. Their special blend of mathematical and moral messaging will shape the future of the pandemic.”
As ever, I appreciate any and all feedback - let me know if I have missed something! And please share my articles if you think others would appreciate them:


Side remark: in 1932, scientific articles and books still looked beautiful. The ugly phase (typewriter with some manual supplements) came later, in the 60s and 70s - until personal computers and Donald Knuth (LaTeX) saved us.
... and thanks for the interesting perspective. I am currently staring at the RKI and DIVI data, in order to get an idea about recent underreporting of Covid (I promised Fabian Spieker to write about this...).
Naturally, if you merely assert "1918 but first year distributed over 4 years," you wind up with no post-1918 deficits. And, in the present era, seropositivity tells us that SAR-CoV-2 receded in 2020 with a lot more fuel left to burn than 1918 H1N1. So it isn't that surprising that H1N1 had some deficit years given that it made a much bigger splash to begin with.
Very good H1N1 paper, thanks for the link.
I refer a lot to Jordan, Edwin O. (1927.) “Epidemic Influenza: A Survey.” Archived online at https://quod.lib.umich.edu/f/flu/8580flu.0016.858