Part 5: What goes up, Must come down?
A Nation Grows Older: Irish deficits deaths, where are they?
Why haven’t death rates fallen, or have they? As ever, the key is to gauge expected mortality rates based on both previous years and population dynamics like size, age, sex, etc. While true that annual death totals in Ireland have not continued to climb after 2022, it also appears they have not fallen back below trend (so-called deficit deaths) to balance out the excess deaths of 2021-2023.
This article may appear incomplete in e-mail form due to the number of graphs, please go to https://lostintranslations.substack.com to read the complete post.
Raw Numbers
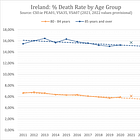
The following graph shows recorded annual all-cause deaths from 2011, and projections by CSO and Eurostat for Ireland up to 2030.
No expertise is needed to see the sudden hump in numbers of deaths during pandemic years and to recognise those years have experienced deaths above and beyond expected levels. It should also be noted that prior to the pandemic both CSO and Eurostat had already forecast rising death totals for Ireland, with the Eurostat projections being more recent and more accurate.
===WARNING===
At this point, a friendly reminder that Eurostat’s elsewhere reported monthly estimates of excess mortality for Ireland are nonsensical because the methodology ignores its own reasonable projections of rising deaths (see graph above). Instead, when producing estimates of excess mortality, Eurostat opts for an out-dated and inappropriate pre-pandemic average (2016-2019) as a baseline for expected deaths (see dashed horizontal line in image above).
===END===
More (and Less) than Expected
Despite the official narrative in Ireland that it was one of the best little countries during the pandemic, claiming it experienced next to no excess mortality, it most certainly did. Of interest to me are the more granular details: to what extent, when exactly, who exactly, where exactly did those excess deaths happen? Cumulatively speaking, we shall see that “when exactly” was primarily from mid 2021 through mid 2023. Thereafter, excess mortality seems to have abated with 2024 potentially back on pre-pandemic trend.
When can we expect deficit deaths to balance the excesses? Some possibilities:
The pandemic brought excess deaths, the deficit deaths are about to kick in
The deficit deaths preceded the pandemic - we just didn’t notice it
We are back on trend with no deficits in sight, huh?
Recall, excess deaths are effectively when, statistically speaking, someone dies “before their time”. If significant numbers of individuals die before their time (resulting in excess deaths) they can obviously no longer die subsequently, at their statistically expected age, which theoretically results in subsequent deficits. So where are the deficit deaths in Ireland?
Split-Year Analysis
A split-year approach examines not calendar years, but 12-month cycles, in our case from July through to June. While the reader might claim the choice of split-year analysis is a type of cherry picking, it is a reasonable approach to try to ensure the sampling period encompasses only a single winter season or peak, thus avoiding any amplification or cancelling of successive seasonal peaks (which we have previously seen does not always conveniently stay in the same calendar month). Cumulative totals remain the same but we can better attribute excesses or deficits to the seasons in which they actually occurred.
So far, many published analyses of Irish deaths have overlooked or down-played cumulative trends by focusing more narrowly on shorter peak/off-peak periods. We consider this a flawed approach for neglecting the broader seasonal cycles and trends in mortality rates. For example, EuroMomo, a European monitoring system oft referenced by the Irish Minister for Health, only flags individual weeks when mortality significantly exceeds the corresponding baseline for that week. It apparently fails to flag months or quarters of consistently moderately above average mortality unless multiple weeks exceed baseline and are flagged.
Here are CSO “revised” death totals for 2007/8 - 2020/21 and extrapolated death totals for 2020/21 - 2023/24 from weekly figures CSO provides to Eurostat. The totals in red are necessarily provisional (see footnote1 in graphic). The dashed trend line projection is for illustrative purposes.
2018/19 saw deaths fall below expected levels by about a similar if not greater amount than deaths rose above expected levels in 2019/20. The steady pre-pandemic rise in annual deaths remains clearly recognisable and we get our first glimpse that:
Number of death occurrences has already started to fall after peaking in 2022/23
Split-year analysis emphasises 2018/19 was a deficit deaths year with significantly less deaths (~3%) than expected by long-term trend
2020/21 indicates no overall excess
Death and Old Age - Common Sense
Not surprisingly, the elderly (80+), although comprising the smallest share of the population, account for the highest mortality rates and the largest share of deaths in Ireland. Indeed, almost three quarters of all deaths normally occur in the 70+ population despite its only ~10% (albeit growing) share of the total population.
Assuming the declared pandemic resulted in any significant excess mortality in 2020-2021 we should see this reflected in the death rates of the elderly which were also reportedly those most at risk from Covid-19.
Split-Year Analysis by Age Group
Previously, in Part 3 of our series on Irish mortality trends, “A Nation Grows Older: Disparate Mortality Trends and Other Demographic Curiosities” we looked at annual mortality rates per age group.
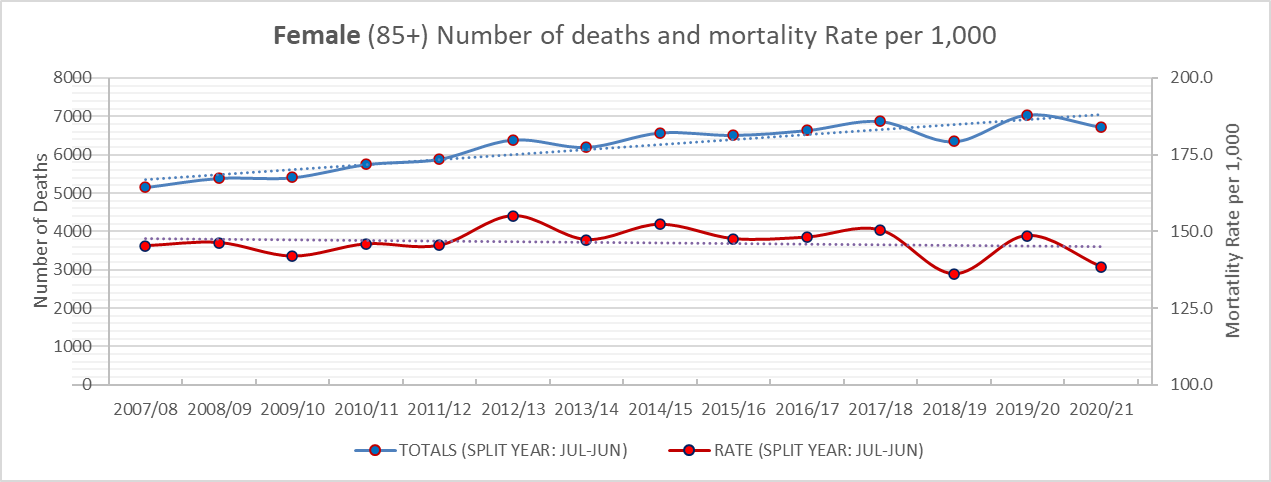
Monthly deaths data by age group are now available from CSO up to 2021 permitting a split-year analysis by age group. In the following graphs, blue lines will continue to show death totals (number, left axis), red lines show death rates (per 1,000 population, right axis) of corresponding age-group. The trend lines (2007/8 - 2020/21) are primarily for illustrative purposes.
We examine first the 85+ ages, which many would instinctively assume must have suffered excess deaths in the initial pandemic years, considering the reported median age of Covid-19 deaths in 2020-2021 was 82. Closer inspection reveals the very important, and too-oft overlooked phenomenon regarding mortality trends in Ireland: 2018/19 was the all-time record-low in mortality levels for most older age groups. By any standard methodological approach, 2018/19 was a year of significantly lower than expected mortality in Ireland.
In age group (85+), we find deficit deaths preceding the pandemic which more than balance out excess deaths during the initial pandemic waves. Indeed, the graph suggests deaths fell under the long-term trend again in 2020/21.
Government and public health officials should have been aware of the deficit mortality in 2018/19 and have been primed to expect elevated, i.e. higher than normal mortality rates (and death totals) the following season.
===ASIDE===
Analysis from researchers at Maynooth University of RIP.ie death notices, which was widely touted by state media broadcaster RTÉ and others during the pandemic, based estimations of excess deaths for a sampling period of Mar 2020 - Mar 2021. This was a shameful exercise in cherry-picking a sampling period which mislead the public with exaggerated claims of significantly higher mortality than expected. The researchers also incredibly neglected the critical context of Ireland’s rapidly growing and aging demographics.
Summary: Yes, they correctly proclaimed April death occurrences were significantly higher than previous years; No, they wrongly claimed seasonal death occurrences were significantly higher than could reasonably have been expected (excess mortality)
===END===
Split-Year Analysis by Age and Sex
Here we address another important trend in Irish mortality rates. Women have higher life expectancy, living on-average to an older age. But because the elderly female population is disproportionately larger, this still results in significantly higher numbers of deaths of women. Note also, that mortality rates in women and men have been falling at different rates (trend lines for illustrative purposes only).
Indeed, here we see that mortality rates in female over 85’s (red line, right-axis) has broadly speaking levelled out - with the notable exceptions of excess year 2012/2013, and deficit years 2018/19, 2020/21. The overall mortality rate for the first pandemic year 2019/20 does not register as anything out of the ordinary and 2020/21 exhibits less deaths than expected.
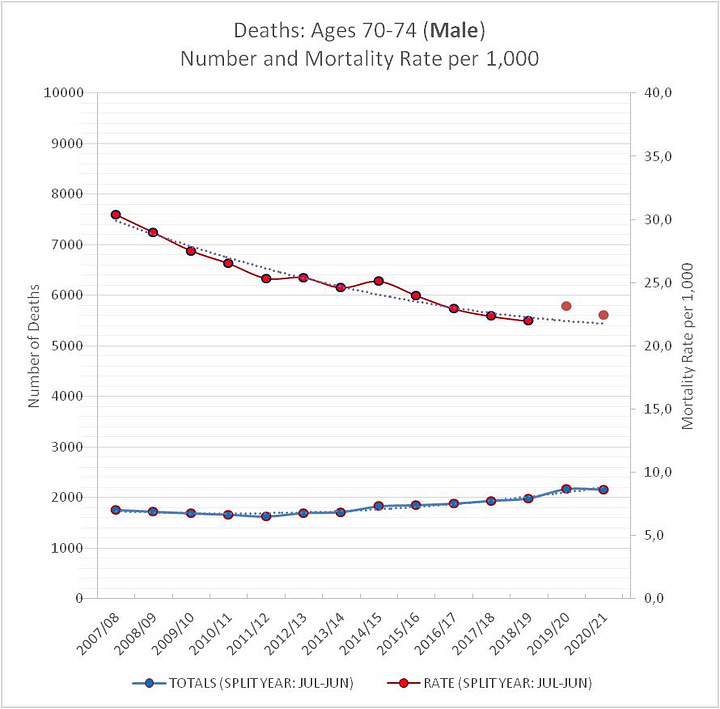
Meanwhile elderly Irish men have continued to overall see small improvements in life expectancy as their mortality rates have continued to fall though remain significantly higher than for women. Although the mortality rate of 2012/13 indicates significant excess, the small population size of elderly men meant the rise in the number of deaths was ~150.
The overall mortality rate for the first pandemic year 2019/20 indicates some excess following the significant deficit of 2018/19. The first full split-year affected by Covid was 2020/21 and exhibits overall normal rates of mortality for men and deficits for women. That both sexes have seen steadily increasing numbers of annual deaths (blue lines) is simply due to the ever-increasing size of the elderly population despite their falling/stable mortality rates (red lines).
Split Year Analysis by Age, Sex, and Seasons
Focusing on mortality rates per 1,000 age-group population but zooming in to meteorological season level allows us to better gauge the distribution of deaths within individual split-years. In Ireland the meteorological seasons are as follows:
Winter: December, January, February
Spring: March, April, May
Summer: June, July, August
Autumn: September, October, November
While the reader may be more familiar with calendar quarters, they again present the issue of splitting the typical peak winter season across two sampling periods, namely Q4 and Q1. In addition, we find the meteorological seasons a more intuitive division of the mortality year, particularly for the elderly deaths which exhibit the strongest seasonal correlation. Met Éireann, the Irish meteorological service writes:
For climatological and meteorological purposes, on the basis of air temperature, seasons are regarded as three–month periods as follows: December to February – winter; March to May – spring; June to August – summer; and September to November – autumn. This is a common grouping in the meteorological practice of many countries in the middle and northern latitudes.
CSO provides annual mid-April population figures and these were linearly regressed to calculate individual mid-month population estimates. We have first standardised to 30-day monthly rates before summing to create 90-day season rates2.


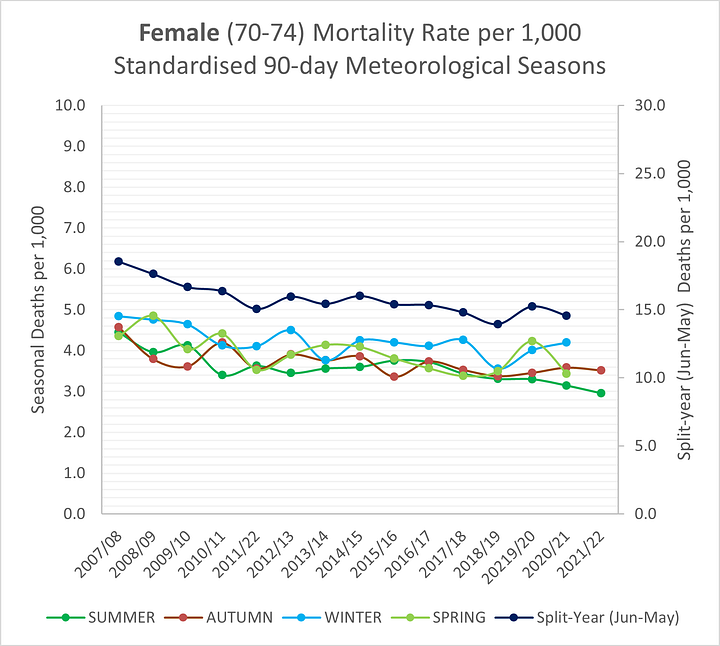
Here, the top lines are split-year (summer-spring) mortality rates and those below represent the individual seasons of those split years. Again, most remarkable in both graphs, females (left), and males (right), is the sharp fall in mortality rates during winter 2018/19 which remained low in winter 2019/20 followed by the peaks in spring 2020. Interestingly, the notable excess mortality rates of 2012/13 were also caused primarily by an atypically high spring mortality rate.
Narrowing down the deficit deaths to meteorological seasons, we can determine that the all-time record low mortality rates for 2018/19 were primarily due to an atypically low winter season. Cumulatively, the significant excess mortality in the atypically high spring season (2020) is offset by the lower than normal mortality one year prior in winter 2018/19. This observation was rarely reported in the early stages of pandemic fear and panic.
Split-Year Analysis by Age and Months
In Part 4 of our series on Irish mortality trends last year “A Nation Grows Older: Disparate Mortality Trends and Other Demographic Curiosities” we looked at monthly crude mortality rates.
Now that monthly deaths data by age group is also available from CSO we can calculate age-specific mortality rates per month.
Here, mortality rates for the 85+ age-group are again examined, but now at the level of standardised 30-day months. This makes it possible to more readily compare months across years and also facilitates comparison between months of varying length, e.g. January vs February, which normally has ~10% less days. Below, split years 2017/18 (left), 2019/20 (middle), and 2020/21 (right) are highlighted.


The 2020 April (middle image) peak in death occurrences of over 85’s resulted in mortality rates per 1,000 equivalent to January peaks in 2009, 2017 and somewhat higher than 2015 and 2018 (left image). The atypically high spring mortality in 2020 was overwhelmingly due to the single-month peak in April. While the cumulative mortality rate of winter-spring 2018 was almost identical to 2020, it had a much broader monthly distribution.
Winter 2020/21
Although 2020/21 (right image) saw the very large Jan-Feb peak in over 85’s mortality rates resulted in only moderate cumulative excess because of the unprecedentedly low mortality rates both before and after the winter peak. It appears the mortality curve was flattened below normal levels only to erupt in a sharp peak during winter.
Noteworthy also are data from Ireland’s Covid-19 Data Hub showing test-positivity, hospital admissions, ICU cases, and “confirmed” Covid-19 deaths had all peaked in January 2020 and had started to fall before Ireland’s vaccination campaign had started in earnest in ~week 6 (very limited numbers were vaccinated in January).
What About Other Age Groups?
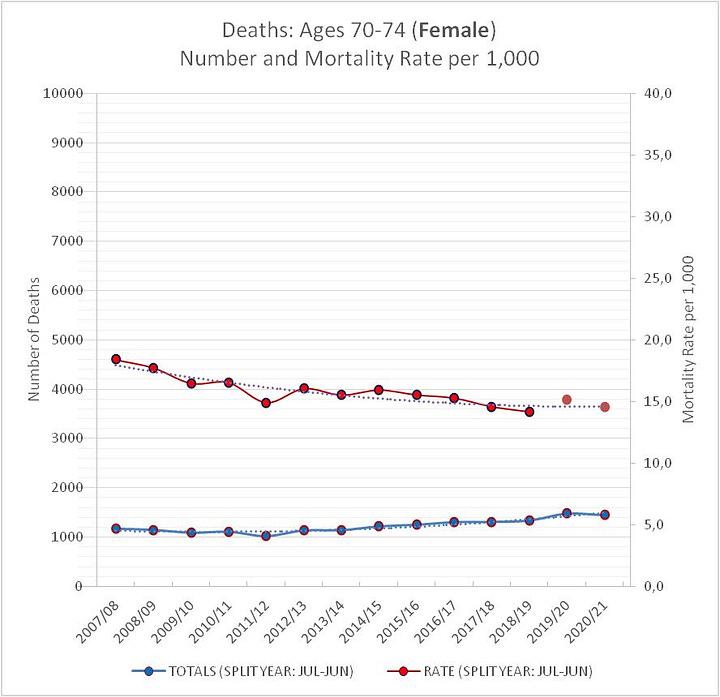
Unfortunately, 85+ is the oldest age grouping available (ideally we would like to have 85-89, 90-99, 100+), and has been selected as the age group most likely to show evidence of pandemic induced excess mortality. Looking at split-years for other age groups over 65 shows a similar trend: numbers of deaths up; mortality rate per 1,000 down, or on trend (with the notable exception of 70-74 which, although less uniform, is suggestive of excess deaths in 2019/20).


Examining the 70-74 age group more closely, the annual mortality rate analysis also indicates an increase and so we have zoomed in to meteorological seasons (below). While the winter mortality rate was lower than expected, seasonal analysis shows not only did this group experience a ~20% higher mortality rate in spring 2020 but males had also higher summer and autumn mortality rates in 2019.

It is possible (as per the illustrative trend line) that both 2017/18 and 2018/19 were moderate deficit years, and that 2019/20 was a type of over-correction year, before resuming its downward trend in 2020/21.
==UPDATE/Edit== Selecting a quadratic trend line for the 70-74 age group (as for ages 65-69, 75-79, 80-84) explains the anomaly! This shows the importance of analysing male and female cohorts separately, and also shows the sensitivity of excess deaths estimations on the assumptions made around trends and projections.
==END==
Findings
In years 2019/20 - 2023/24 the number or death occurrences has risen significantly above levels of recently preceding years. Applying a split-year (July-June) analysis and adjusting for population growth and aging, we have shown:
Total recorded death occurrences in the initial pandemic years 2019/20 and 2020/21 are cumulatively in a reasonably expected range of mortality.
Age groups over 65 (with possible exception
s: males 70-74, andover 85’s) did not experience mortality rates significantly above reasonably expected levels in 2019/20.
(UPDATE: see corrected trend lines for 70-74 age group added above)The split-year 2018/19 preceding the pandemic was a year of significant deficit mortality rates, effectively balancing any excess of 2019/20.
2020/21 was a year of overall cumulatively normal mortality rates, with the age group 85+ (both males and females) recording deficit mortality.
Years 2021/22 and 2022/23 clearly show significant levels of excess mortality .
Pandemic death totals appear to have peaked in 2022/23 and may be returning to pre-pandemic trend in 2024.
Summary
Needless to say our findings fly in the face of the conventional narrative about deaths during the pandemic which was propagated at the time by the Irish government, public health, national media, etc. Death occurrences were significantly up in the pandemic, BUT age-adjusted death rates per 1,000 were in the reasonably expected range in the initial phase 2019/20 - 2020/21. That ordinary citizens may not have appreciated the affects of population change on mortality trends and the expected number of deaths is understandable, but the relevant organisations and authorities certainly should have.
What did they know?
Incomplete datasets (if sampled consistently3) can still reveal true trends. So let us briefly turn to official CSO annual report data and see what should long be clear to Irish public health authorities. Recall this chart we have previously produced using only official CSO and Department of Health figures based on CSO so-called “final” death occurrences. While the figures used are incomplete (see footnotes), the overall trends remain indisputable:
significantly rising annual death totals since 2020,
moderately rising crude mortality rate, and
significant excess mortality in 2021-2022 as indicated by Department of Health’s Age-Standardised Mortality Rates above trend
provisional data for 2023 show similar annual numbers of deaths as 2022, when updated, Dept. of Health ASMR figures will also show excess mortality for 2023.
Ireland has suffered significant cumulative excess deaths (we have previously estimate 5~7%) from mid-2021 to mid-2023. How the Minister for Health can maintain otherwise, especially in light of his Department’s own calculations, remains indefensible.
Next Steps
The next stage will be to explore the rates of under 65’s on the same seasonal and monthly basis, and to compare the number of Years of Life Lost YLL between the younger and older groups, before updating our findings when monthly data by age group is updated later this year to include 2022. Instead of using rolling age groups, an alternative approach being explored is to examine mortality rates of individual cohorts or birth years similar to
, however single-year-of-age deaths data will be required from CSO for such an analysis.Final note, if the excess mortality is not found to be primarily in the older age-groups but rather in the younger, then any expected deficit deaths may be a long time coming.
Other News
In other Irish demographic news, the CSO released new and updated Population and Labour Force Projections 2023 - 2057, which include projections of deaths. And the Department of Social Protection has announced that the new Civil Registration (Electronic Registration) Bill 2024 has finally been signed into law which will ensure timely registration of deaths in Ireland. There may be time for a further post on these developments.
CSO has estimated that “cleaned" RIP.ie death notices ultimately remain 3~5% below number of actual death occurrences.
=> Weekly Eurostat figures have been multiplied by factor 1.04 to estimate actual death occurrences.
Alternatively, the deaths for the 3 months of each season could have been summed before standardising to 90 days (the differences are negligible).
In an effort to improve the completeness of the “final” Death Occurrences figures released in CSO Vitals Statistics Annual Report, the CSO in 2020 changed the point when it extracted death occurences data to Q3. This frustratingly makes the 2020 figure more complete than the immediately preceding years. It remains to be seen for 2021 and onward, though they too are potentially more complete than “final” figures for 2015-2019.


